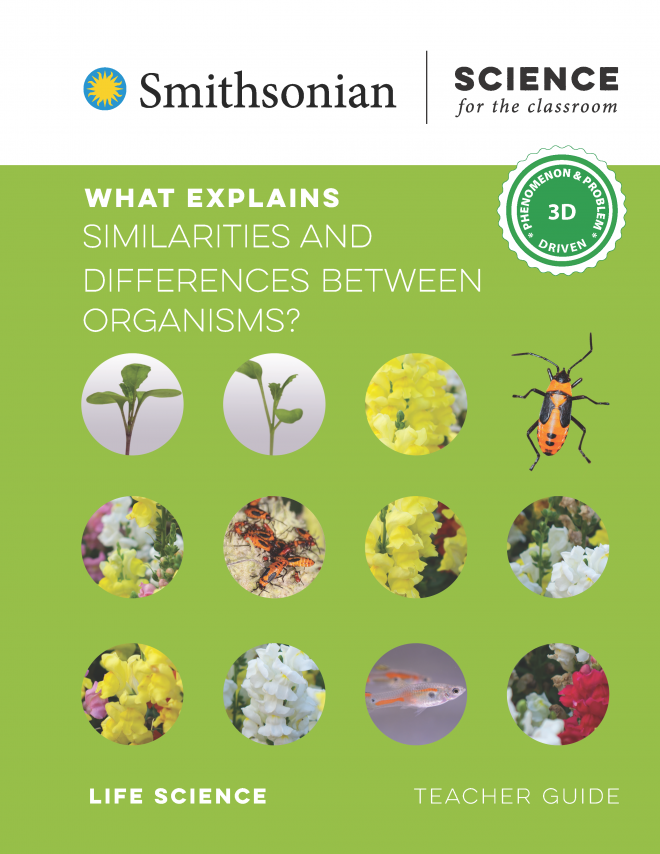
What Explains Similarities and Differences Between Organisms?
What Explains Similarities and Differences Between Organisms?
WHAT EXPLAINS SIMILARITIES AND DIFFERENCES BETWEEN ORGANISMS? is part of Smithsonian Science for the Classroom, a curriculum series by the Smithsonian Science Education Center. It is aligned to a group of grade 3 standards. It has a focus on life science with a secondary focus on earth and space science. In this module, students:
- Make observations of variation in traits in Wisconsin Fast Plants and analyze data for patterns of inheritance
- Collaboratively plan, carry out, and analyze the results of fair tests to see the effect of environmental variables on plant traits
- Analyze average temperature and precipitation data for a range of cities to uncover patterns of climate zones
- Develop a model that represents the stages common to all organisms’ life cycles
- Analyze data from a study on how bees’ preference for certain flower colors gives plants a reproductive advantage
- Construct an explanation for why guppies in some streams are bright orange while others are dull
Below are digital resources that support teaching of this module.
Family Letter
Prior to starting What Explains Similarities and Differences Between Organisms? share the Family Letter with students’ caregivers. Indicate how they should submit responses to the letter.
Download the Family Letter PDF
Biodiversity Coloring Book
This link leads to a coloring book featuring organisms from the Biodiversity Heritage Library.
https://www.biodiversitylibrary.org/collection/ColorOurCollections
Smithsonian Zoo News
This website provides articles about the animals at the National Zoo. Scroll through the articles or use the search function to find articles about parents and offspring.
https://nationalzoo.si.edu/animals/news
Environmental Factors (1:02 minutes)
This video shows several environmental factors that could affect plant growth, including rain, sun, snow, wind, and nutrients.
Download the Environmental Factors Video
Download the Accessible Version of the Environmental Factors Video
Download the Environmental Factors Video Transcript
Tilted Trees
These images show two trees that are growing at a sharp sideways angle because of constant wind.
Download the Tilted Trees PDF
Radish Plant Video (0:29)
This video shows several radish plant seedlings emerging from the soil and extending their cotyledons (the seed leaves).
Download the Radish Plant Video
Download the Accessible Version of the Radish Plant Video
Download the Radish Plant Video Transcript
Weather Words
This file provides descriptive terms for a set of summer temperature and precipitation conditions.
Download the Weather Words PDF
Summer Temperature Graph for Washington, DC
This bar graph shows the average summer temperature in Washington, DC from 1998‑2017.
Download the Summer Temperature Graph for Washington, DC PDF
Köppen Climate Map
This map of North America uses color to show the range of climate zones as well as the location of 16 cities.
Download the Koppen Climate Map PDF
Milkweed Eggs
This image offers students a high resolution visual for use in observing the milkweed eggs.
Download the Milkweed Eggs PDF
Monarch Life Cycle Video (1:49)
This narrated video from the United States Fish and Wildlife Service shows an adult monarch emerging from a chrysalis and hanging upside-down as its wings expand with fluid.
https://www.youtube.com/watch?v=OM-ptuFr-zc
Snapdragon Study
This PDF slideshow introduces students to the snapdragon research taking place at the Rocky Mountain Biological Laboratory. It provides visual support for introducing the central phenomenon.
Download the Snapdragon Study PDF
Snapdragons!
This simulated field study allows students to conduct data based on a real-world investigation conducted at the Rocky Mountain Biological Laboratory.
https://ssec.si.edu/aww-snap
Bumblebee Video (0:13)
This video shows bumblebees interacting with flowers.
Download the Bumblebee Video
Download the Accessible Version of the Bumblebee Video
Download the Bumblebee Video Transcript
Field Site with Dull Guppies (1:05)
This video goes underwater to show guppies swimming in a stream.
Download the Field Site with Dull Guppies Video
Download the Accessible Version of Field Site with Dull Guppies Video
Download the Field Site with Dull Guppies Video Transcript
Trinidadian Streams and Guppies
This file contains a map of Trinidad and Tobago and photos of the field site, scientists at work, and the guppies in the study.
Download the Trinidadian Streams and Guppies PDF

Kit Tips & Tricks