Mobile Apps for Citizen Science
Citizen science projects engage members of the public in scientific research. With the Next Generation Science Standards' emphasis on science and engineering practices, these projects provide an ideal way to involve students in the process of scientific investigation. An abundance of mobile apps makes participation in citizen science projects easier than ever and allows data entry in the field. Here is a selection of apps that we found particularly useful for engaging students. All of the apps listed are free, with the exception of the BirdLog app which costs $9.99 to download.
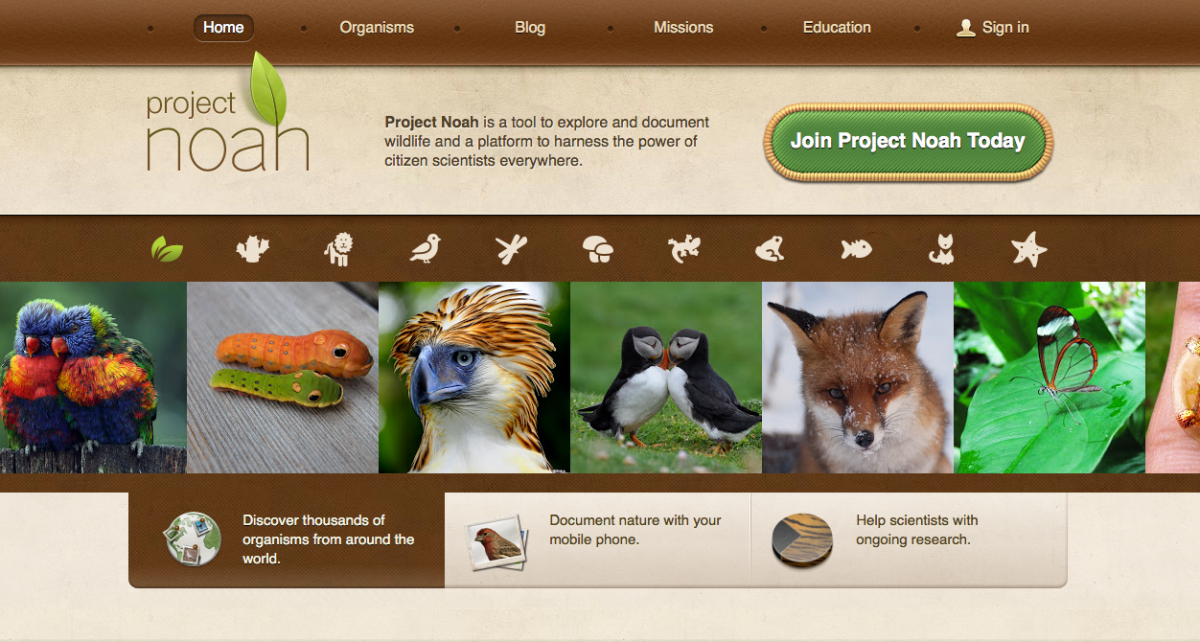
Project Noah launched out of NYU and is supported by National Geographic. It provides a platform for documenting a wide range of the world's organisms. This app has three main functions. The first, the spotting tool, allows citizen scientists to upload personal photos of wildlife and plants. Users can categorize a species according to its common and scientific names and habitat, identify its location via the GPS capabilities of their mobile device, and add tags and other descriptive information about the image. If the user is not sure about the species in a photo, the app has a function that provides feedback from other users on identification. The second function, the location-based field guide, lets users find information on plants and animals that other citizen scientists have uploaded. There are different filters in the field guide for reviewing recent spottings of wildlife and plants in the user's area and around the world. Finally, the field mission tool connects users to local and global research projects with specific data needs. For example, one might choose to upload data on organisms spotted in wilderness areas for The Wild Foundation or submit photos of bats to help the Bat Conservancy plan conservation efforts.
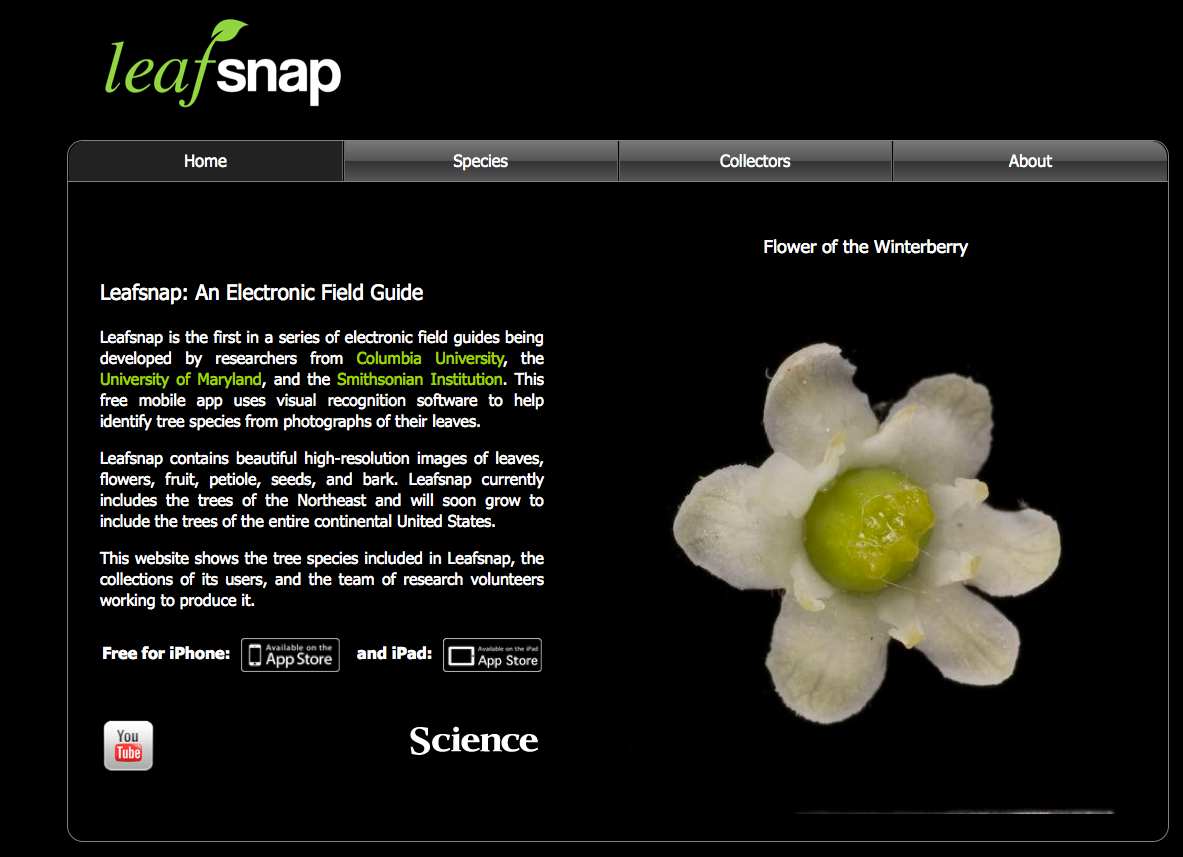
Leafsnap is an electronic field guide developed by Columbia University, the University of Maryland, and the Smithsonian Institution. The app includes images of leaves, flowers, fruit, petiole, seeds, and bark from different tree species, and features visual recognition software that helps users identify a species of tree by uploading images of a leaf. It shares data uploaded by users, including the location and species, with scientists mapping the distribution of flora across the country and lets users view species documented in their area.
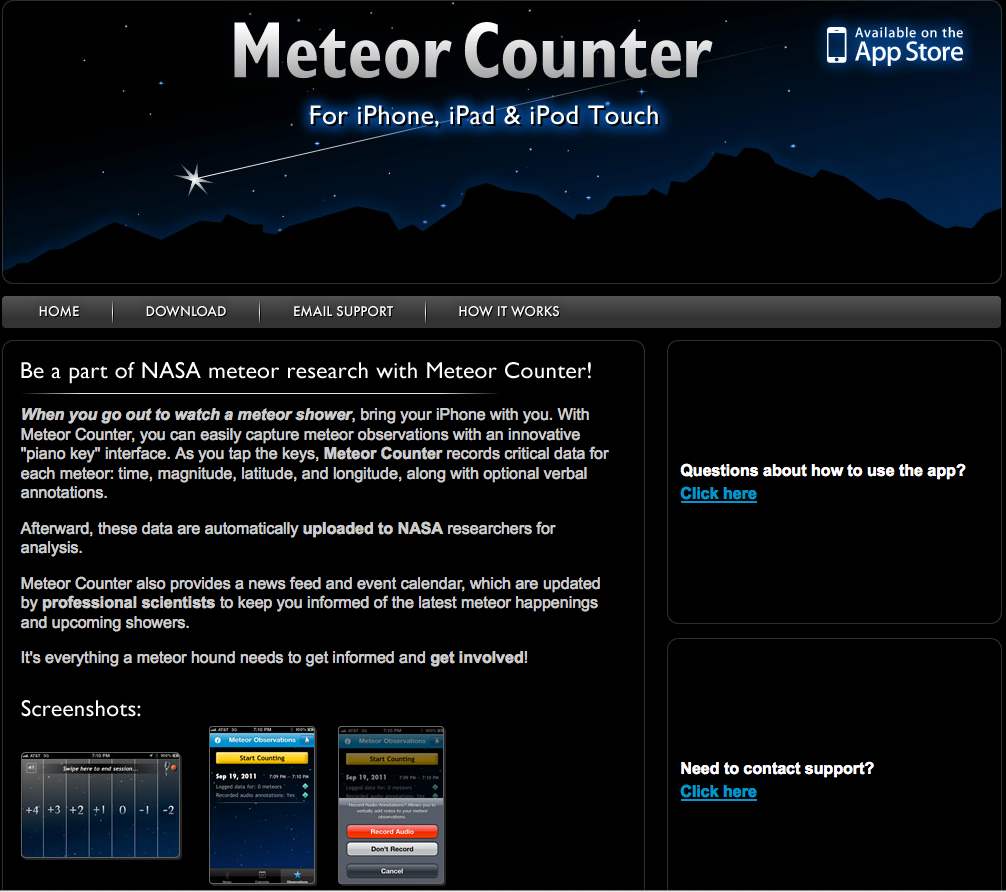
Meteor Counter, developed by NASA, gives citizen scientists the opportunity to contribute to NASA research. Users document astronomical magnitudes of meteors observed during meteor showers using a "piano key" interface by tapping the key that corresponds to the brightness of each meteor observed. The app records the time and location of each submission. Data are automatically shared with NASA researchers. Professional scientists also connect with participants through a news feed and calendar highlighting meteor-related news and events.
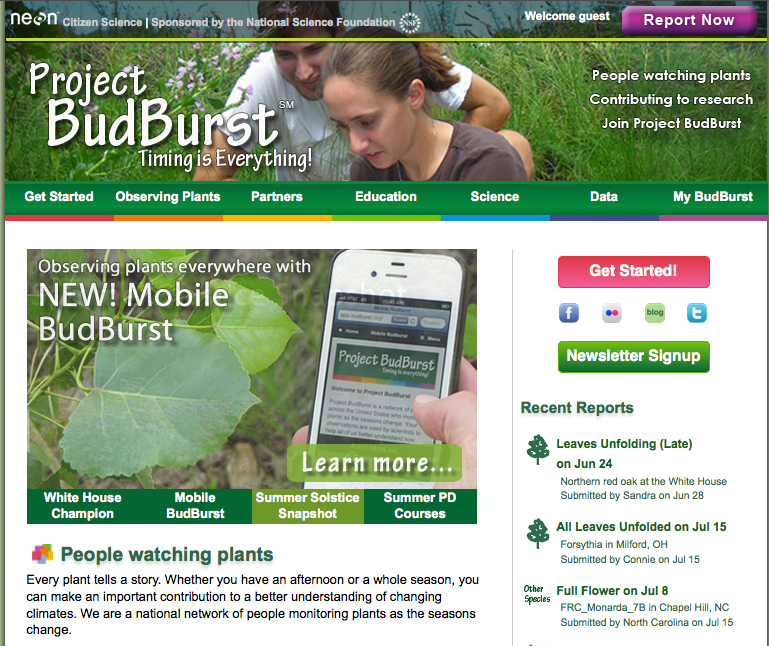
Project Budburst, which is managed by the National Ecological Observatory and Chicago Botanic Garden with support from the National Science Foundation, collects data on the timing of leafing, flowering, and fruiting of plants throughout the year to help scientists investigate the impact of climate change on different species. Users create lists of plants to track and then enter data and images to document the phenological stage of those plants on a regular basis. The app provides support to citizen scientists by offering recommendations for plants to track, information on local species, and lists developed by conservation organizations and other entities of interesting plants. The app also provides background information on each species and images of the different phenological stages of each plant. For fun, the app includes a floracaching game that challenges users to find different types of plants using a variety of clues. (The project also offers a mobile site that will work on any smartphone.)
What's Invasive is managed by the Center for Embedded Network Sensing at UCLA, The Santa Monica Mountain National Recreation Area, and EDDMapS at the University of Georgia Center for Invasive Species and Ecosystem Health. This app is designed to help scientists track the spread of invasive species that are destroying natural habitats. It identifies relevant invasive plants and animals based on a user's location and provides images and descriptions of those species. If users encounter an invasive species they can select the species in the app to send their GPS location to scientists collecting the data. Users can also enter information on the number of species observed (one, few, or many) and add photos and notes to their observation.
iNaturalist is a tool that lets citizen scientists document their observations of nature. Users can upload photos of plants and animals they observe, add notes, and transmit the location, date, and time of their observation. The app provides help identifying an observed species by soliciting feedback from other users. Over time, the app tracks each user's life-list of organisms observed. Citizen scientists have the opportunity to add observations to projects created by organizations or groups that are collecting certain types of data. For example, the Encyclopedia of Life (EOL) has teamed up with iNaturalist to provide an easy way for people to add observations to EOL Collections. EOL projects on iNaturalist include collections such as Birds in North American Cities and State Flowers of the United States. Users can even create their own EOL collections and link them to iNaturalist.
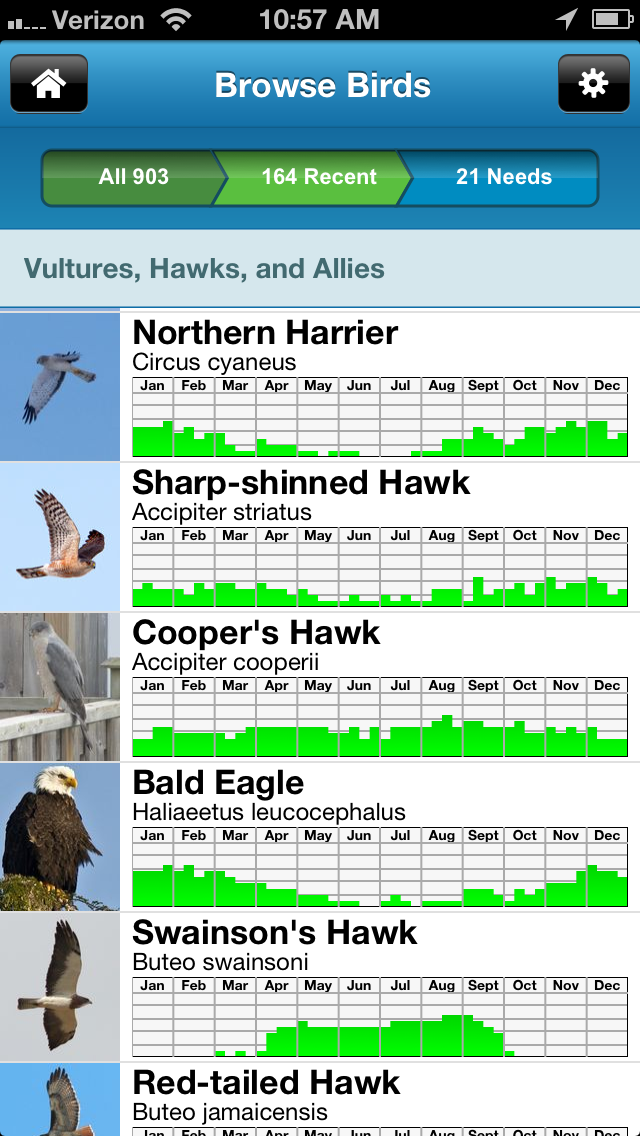
BirdLog is linked to the eBird citizen science project and provides a tool for users to enter data on bird sightings in the field. eBird was started by the Cornell Lab of Ornithology and the Audubon Naturalist Society to compile data on bird abundance and distribution by collecting observations from birdwatchers across the globe. Users can upload species sightings into the app and transmit these data to eBird in real-time. Users enter the location, date, and time of their observation, how their observation was made (for example, did they hike a trail or stand in one spot), and the number of any species seen during the observation period on a checklist. The app also allows users to see what species have been previously reported in their area, view monthly abundance graphs for different locations, create and review their eBird checklists, and access photos and song recordings of various species.